A·IQ pairs Signal building intelligence with Nexus asset management on a shared on-premise infrastructure. One database, one identity layer, one deployment. Buy either independently. Or buy both and close the loop.
Infrastructure underneath, Signal and Nexus on top. Each piece is independently sellable. Together they close the loop.
01
Infrastructure.
Postgres + PostGIS, Redis, OpenBao secrets, FusionAuth identity, Loki + Grafana observability. Row-level security across every tenant. mTLS everywhere.
02
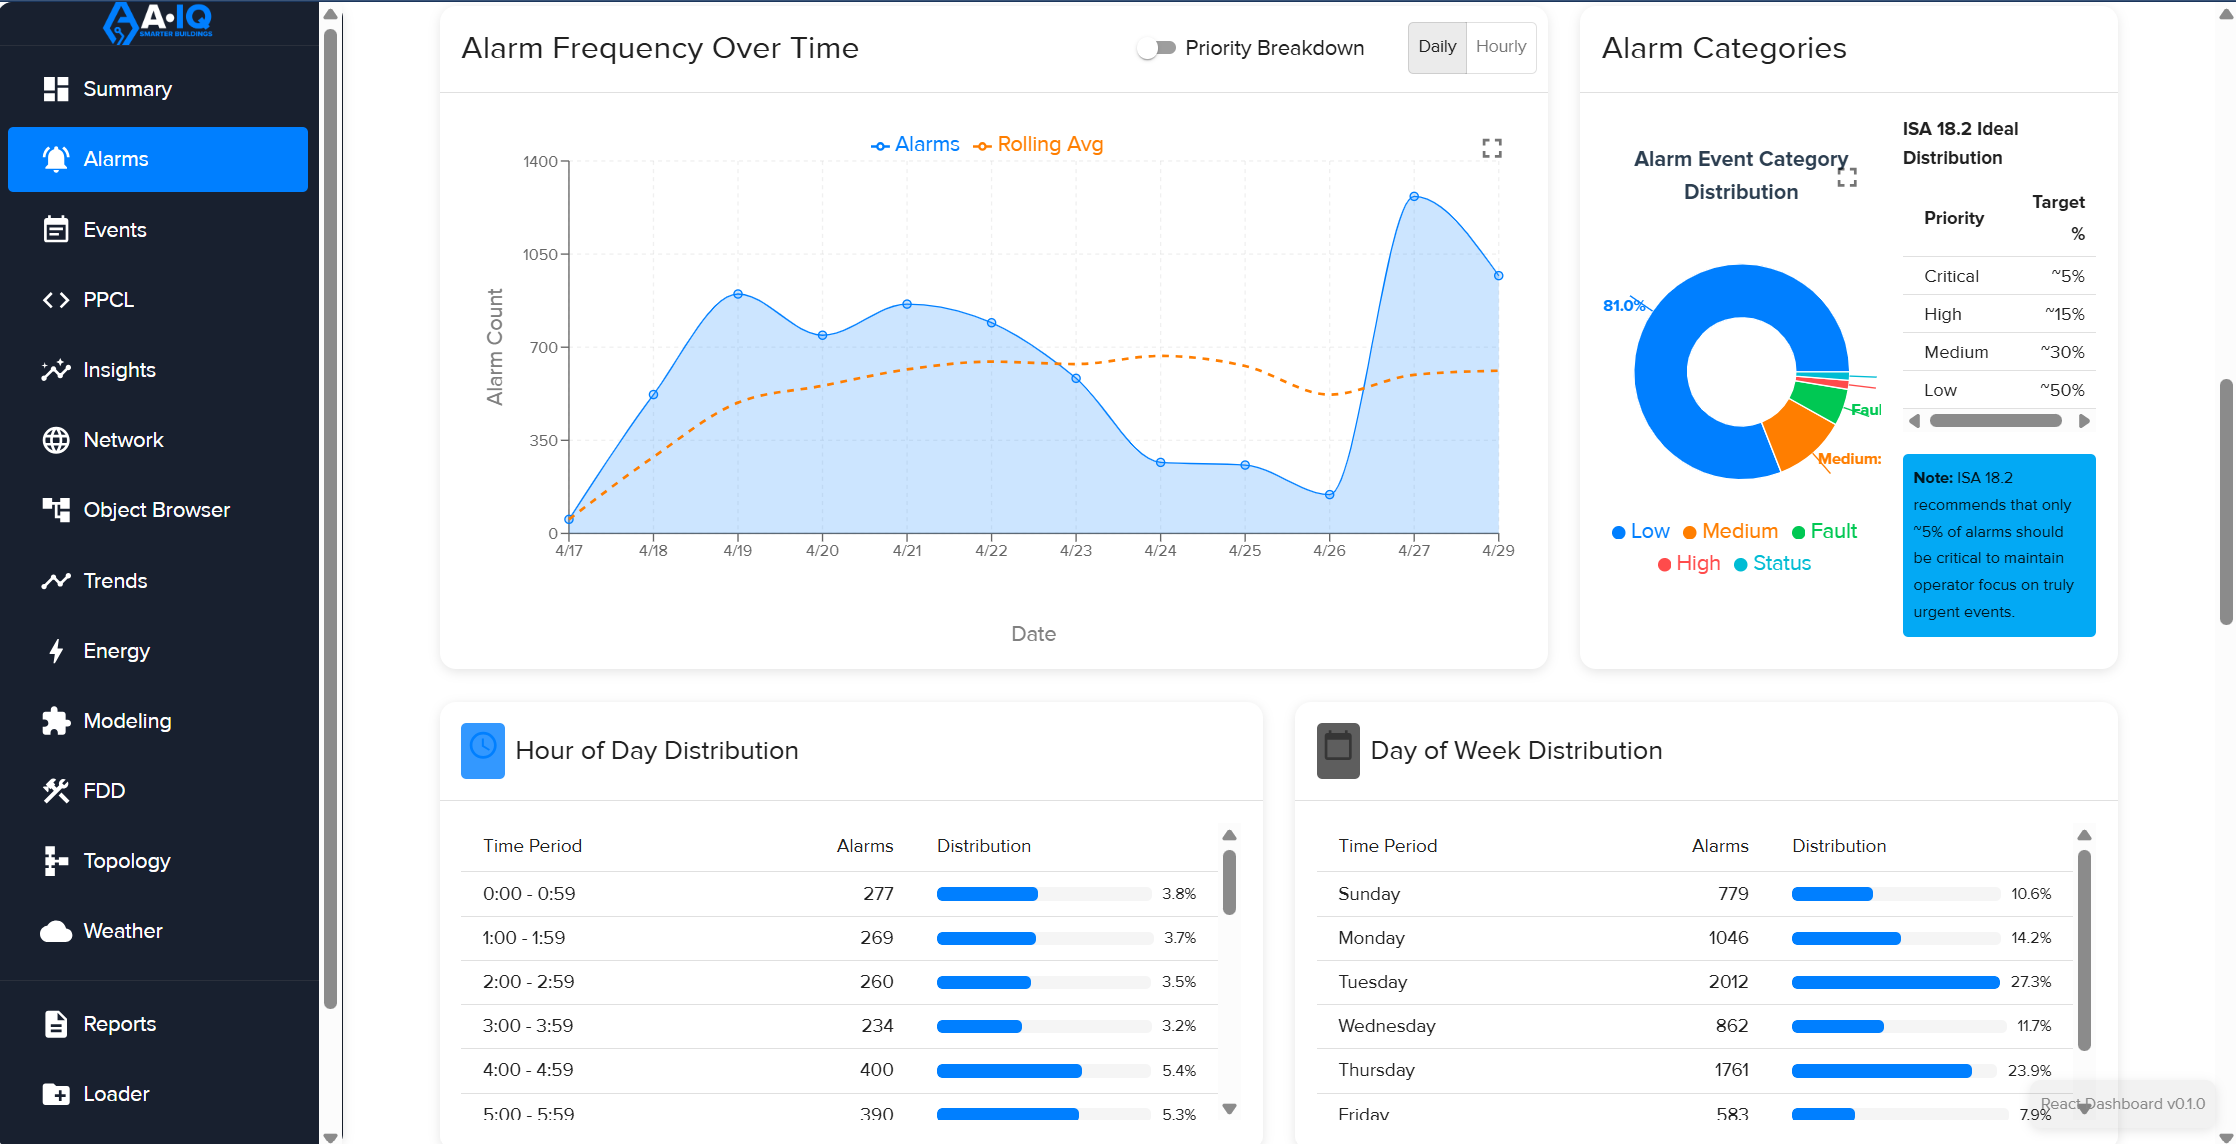
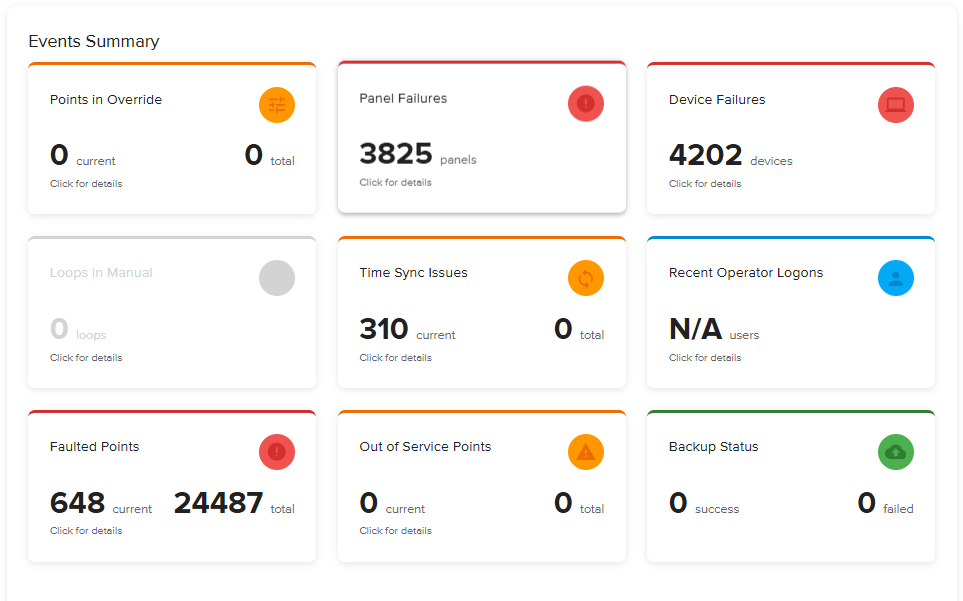
Signal.
BAS intelligence: alarms, faults, root cause, energy, power. Reads BACnet, Modbus, OPC UA. Cuts noise 80%. Names the 12 alarms that matter.
03
Nexus.
Asset and operations: CMMS, capital planning, calibration, spatial, field execution. Auto-creates work orders from Signal faults.
02 / Why Both Together
The closed loop.
Either product solves a real problem on its own. Bought together, the integration eliminates a category of operational drag every facility team accepts as normal.
Closed Loop
Detection → Action.
A Signal fault becomes a Nexus work order automatically with the affected asset, its history, and the right runbook attached. No middleware. No copy-paste between consoles.
Shared Identity
One login.
FusionAuth backs both products. Add a technician once. Permissions, audit logs, MFA same surface across Signal and Nexus.
1
identity layer for both products
Unified Asset Model
One asset registry.
Signal points and Nexus equipment records reference the same underlying asset. The chiller in your alarm log is the chiller in your work order.
Shared History
One timeline.
Alarm event, fault detection, work order creation, technician completion, post-work trend verification one continuous record.
Operations Spine
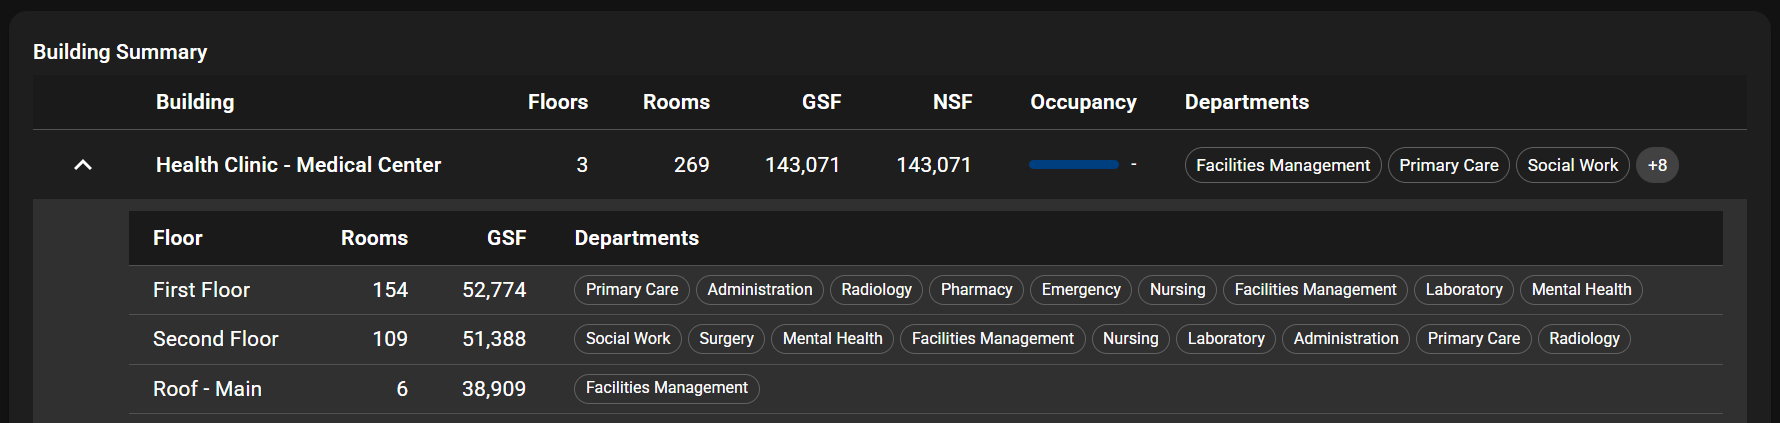
Site → Floor → Asset.
A spatial hierarchy tied to BIM, IFC, and CAD. Both products use the same hierarchy. New buildings drop in without re-modeling.
Telemetry Spine
TimescaleDB historian.
High-cardinality point data, alarm history, energy meters, work order audit all in Timescale with continuous aggregates and compression.
Security Spine
RLS + mTLS.
Row-level security per tenant. mTLS between every service. Secrets in OpenBao. The whole stack assumes hostile networks.
03 / Closed-Loop Operations
Signal identifies. Nexus responds.
The chiller alarm at 04:13. The dispatched technician at 06:00. The verified trend at 08:45. Same record. Same database. No integrators in between.
services:
signal-core: # API + business logicsignal-protocol: # BACnet, Modbus, OPC UAsignal-utility: # Green Button, ESPIsignal-intel: # FDD, RCA, ML scoringsignal-external: # weather, NOAA, utility APIssignal-worker: # Celery task workers
Stack 3
nexus.
services:
nexus-backend: # API + work order enginenexus-frontend: # React UI (MUI)nexus-geoserver: # spatial tile servernexus-fmeflow: # CAD/BIM ingest
05 / Security & Deployment
Built for hostile networks.
On-premise by default. Cloud-deployable when required. Your facility data never leaves your network.
TLS everywhere, secrets in vault, row-level security on every query. Containerized and isolated so one service going down never takes the rest with it.
A·IQ is built by Arcis FM, a Service-Disabled Veteran-Owned Small Business (SDVOSB). Set-aside eligible for federal contracts. CAGE 14DG6 · UEI Z95MQL2KEYG3.
Architecture and procurement questions on the A·IQ platform.
01
Do I have to buy both Signal and Nexus?
No. Signal and Nexus are independently sellable. Many customers start with one and add the other later. The infrastructure stack is shared either way.
02
What does the deployment look like?
Three Docker Compose projects on one or more on-premise Linux hosts. Infrastructure (databases, identity, secrets, proxy) plus Signal and/or Nexus on top. Air-gap deployable.
03
How does pricing work?
Site license, no per-seat fee, unlimited users. Optional managed support and integration services on top. Federal customers can procure direct-award via Arcis FM SDVOSB.
04
What hardware do we need?
Most sites run on a 16-core, 64GB RAM Linux server with NVMe storage. Larger portfolios scale horizontally. We size during the demo.
05
How long does implementation take?
Typical Signal-only stand-up is 4-6 weeks (infrastructure + BAS integration + first dashboards). Nexus migration from spreadsheets/legacy CMMS is 8-12 weeks depending on asset count.
06
Is the platform open source?
No, but the deployment is fully transparent Docker Compose, Postgres, standard open protocols (BACnet, Modbus, OPC UA, IFC). No proprietary lock-in.
See the platform in motion.
A 30-minute walkthrough of Signal and Nexus running against a live building. We will show you the closed loop end-to-end and answer the architecture questions your team has.